


By 2025, it is estimated that 463 exabytes (1018 bytes) of data will be created globally each day [1]. That’s one quintillion bytes of data per day that needs to be categorized, stored, and preserved in order to be accessible, let alone useful. The sheer magnitude of data is daunting and deciding where to begin seems like a herculean task to say the least. Is it even possible to tease out which data are meaningful and to identify patterns and trends amidst the noise?
As organizations try to sort through the deluge of data, the ability of leaders to organize, interpret, and act on data-driven insights has become a critical business differentiator. While data analytics is certainly not a new discipline, gone are the days when the ability to sift through large and complex data pools was something reserved only for powerhouse enterprises with access to the required technological and human resources. Data democratization has enabled data analytics technologies to flourish as businesses of all sizes can now access and analyze both proprietary and publicly-available data in order to drive efficient and informed decisions.
Making Sense of Data Analytics and Visualization
At a fundamental level, data needs to be both relevant and understandable in order to derive the maximum benefit. Data analytics provides the framework to make data relevant, while data visualization helps to make the data understandable. In the past, data analytics and data visualization were thought of as separate processes: analysts would query data sources to generate canned visuals, to which graphic designers would then add cosmetic details. However, as underlying technology and individual skillsets continue to improve and expand, a hyperconnected world fueled by data has rendered this old paradigm obsolete.
The modern business world has evolved and shifted its focus towards an interdisciplinary approach that demands insights beyond boilerplate pie, line and bar charts. Teams that can successfully combine data with design to drive actionable insight and make effective business decisions, will give their organizations a competitive advantage.

Figure 1: The Monticello DataViz Toolkit
“The Greatest Value of a picture is when it forces us to notice what we never expected to see.”
- John Tukey
This shift to an interdisciplinary paradigm closely mirrors the way humans think about and process information – both visually and iteratively. A new generation of software products (e.g. Tableau) realized that if the process of data discovery itself could be made a visual exercise, feedback loops and critical analysis could be integrated at the data collection stage. These newer products leverage the human tendency to search for answers by iterating through questions and ideas in order to bring logic and order to the information at hand. By visually enriching the entire process of data collection and analysis, communication and decision-making can be expedited and improved in as close to real-time as the data source allows.
You Don’t Need Sophisticated Software to Create Enriching Data Visualizations
While specialized data visualization software has become orders of magnitude more powerful in recent years, effective data visualizations can be built using comparatively basic and ubiquitous tools such as Microsoft Excel and PowerPoint.
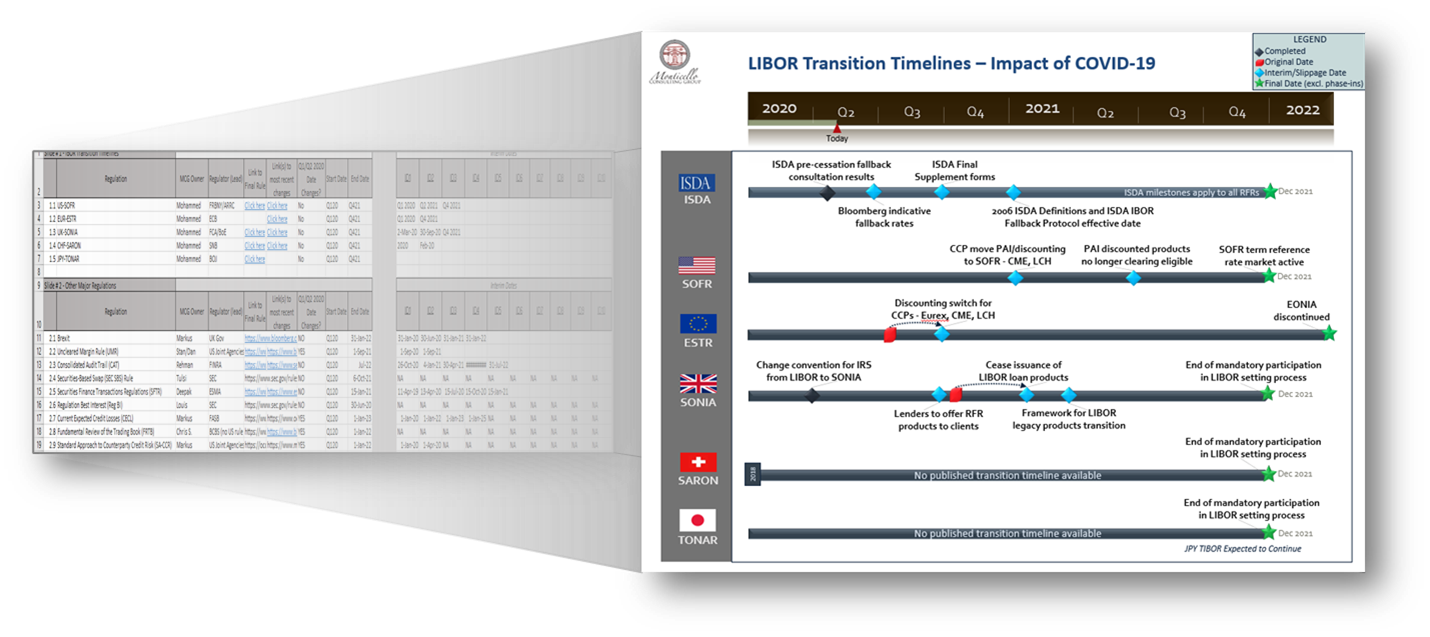
Figure 2
Common programming languages like Python also offer libraries to conduct data analysis (e.g. NumPy) and produce corresponding visualizations (e.g. matplotlib, Seaborn) within the Integrated Development Environment. Producing data visualizations using programming languages requires more technical training than Microsoft Office products or dedicated data visualization tools. In organizations with programming capabilities and resources, this can be a great way to leverage the team’s existing skillset.

Figure 3
More specialized data visualization tools (e.g., Tableau, Microsoft Power BI, Alteryx) are dedicated to a robust data analysis and visualization experience. The power and flexibility of these platforms allow the user to produce real-time and integrated dashboards and visualizations. An investment in training is necessary in order to gain proficiency in using these tools, however, the return on investment can be a significant differentiator in the marketplace.
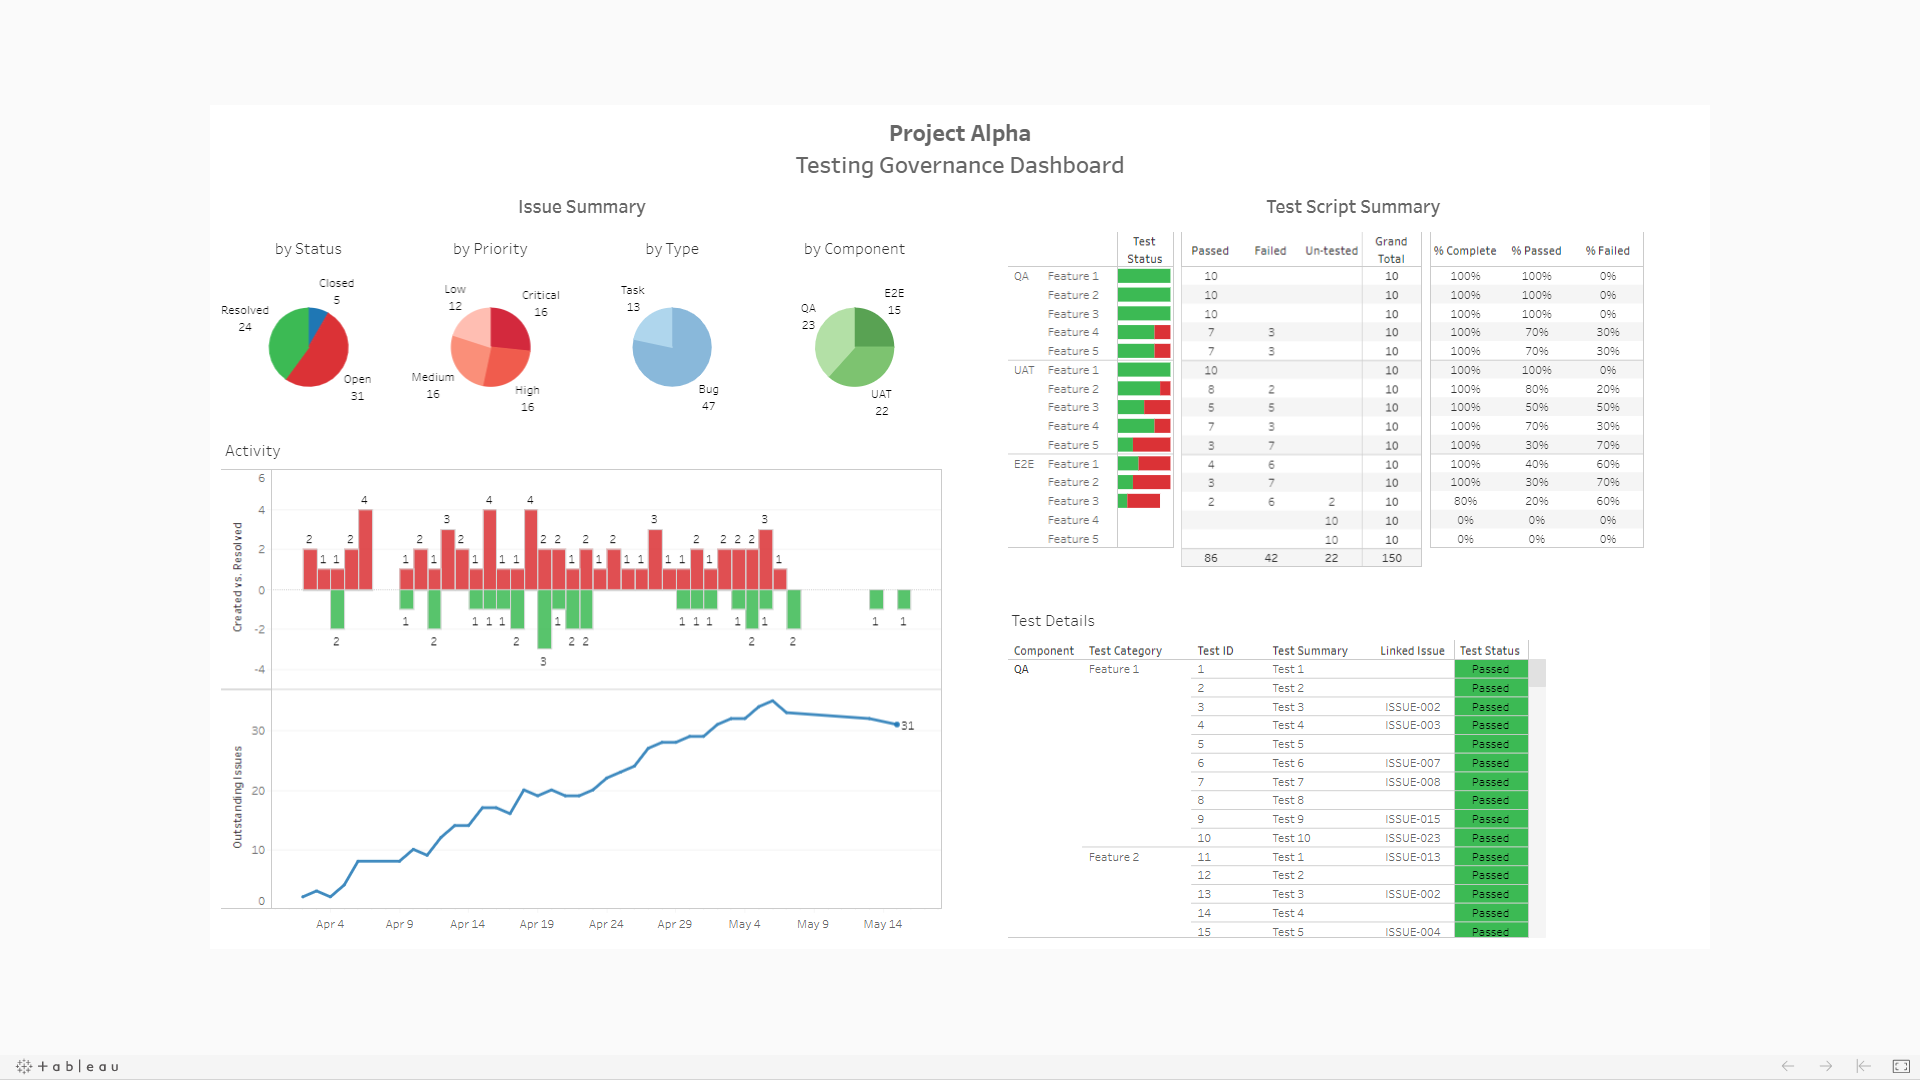
Figure 4: A simple Tableau dashboard to monitor technology testing details in real time
Regardless of the tool (or combination of tools) that you choose to use for data analysis and visualization, the most important step is to dive right in. While focusing on training and building expertise can help to realize the full benefits of these tools in the long-term, they can be short-term barriers to getting started and realizing quick wins. Even though data analysis and visualization software has improved in recent years to become more powerful and user-friendly, the human touch is still required to ensure you are asking the right questions, drawing useful conclusions, and presenting your data in the most compelling way.
About Monticello
Monticello Consulting Group is a management consulting firm supporting the financial services industry through deep knowledge and expertise in digital transformation, change management, and financial services advisory. Our understanding of the competitive forces reshaping business models in capital markets, lending, payments, and digital banking are proven enablers that help our clients remain in compliance with regulations, innovate to be more competitive, and gain market share in new and existing businesses. By leveraging our digital transformation and advanced analytics resources, Monticello guides its clients in the deployment of the latest digital technologies and change management initiatives with confidence and resilience.
[1] https://www.visualcapitalist.com/how-much-data-is-generated-each-day/